Leveraging Data Analytics to Transform Logistics Operations: A Five Star Transportation Case Study

In today's competitive logistics landscape, data-driven decision making isn't just an advantage – it's a necessity. For companies like Five Star Transportation, implementing modern data analytics tools such as Tableau, Power BI, Python, and Streamlit can revolutionize operations across every aspect of the business. Let's explore how these powerful tools can drive improvements in productivity, efficiency, and profitability.
1. Route Optimization and Fleet Management
One of the most immediate benefits of data analytics in transportation comes from route optimization. By analyzing historical traffic patterns, delivery times, and fuel consumption, companies can significantly reduce operational costs while improving service quality.
Key Analytics Applications:
- Real-time fleet tracking and performance monitoring
- Predictive maintenance scheduling
- Fuel efficiency analysis
- Driver performance metrics
- Dynamic route optimization
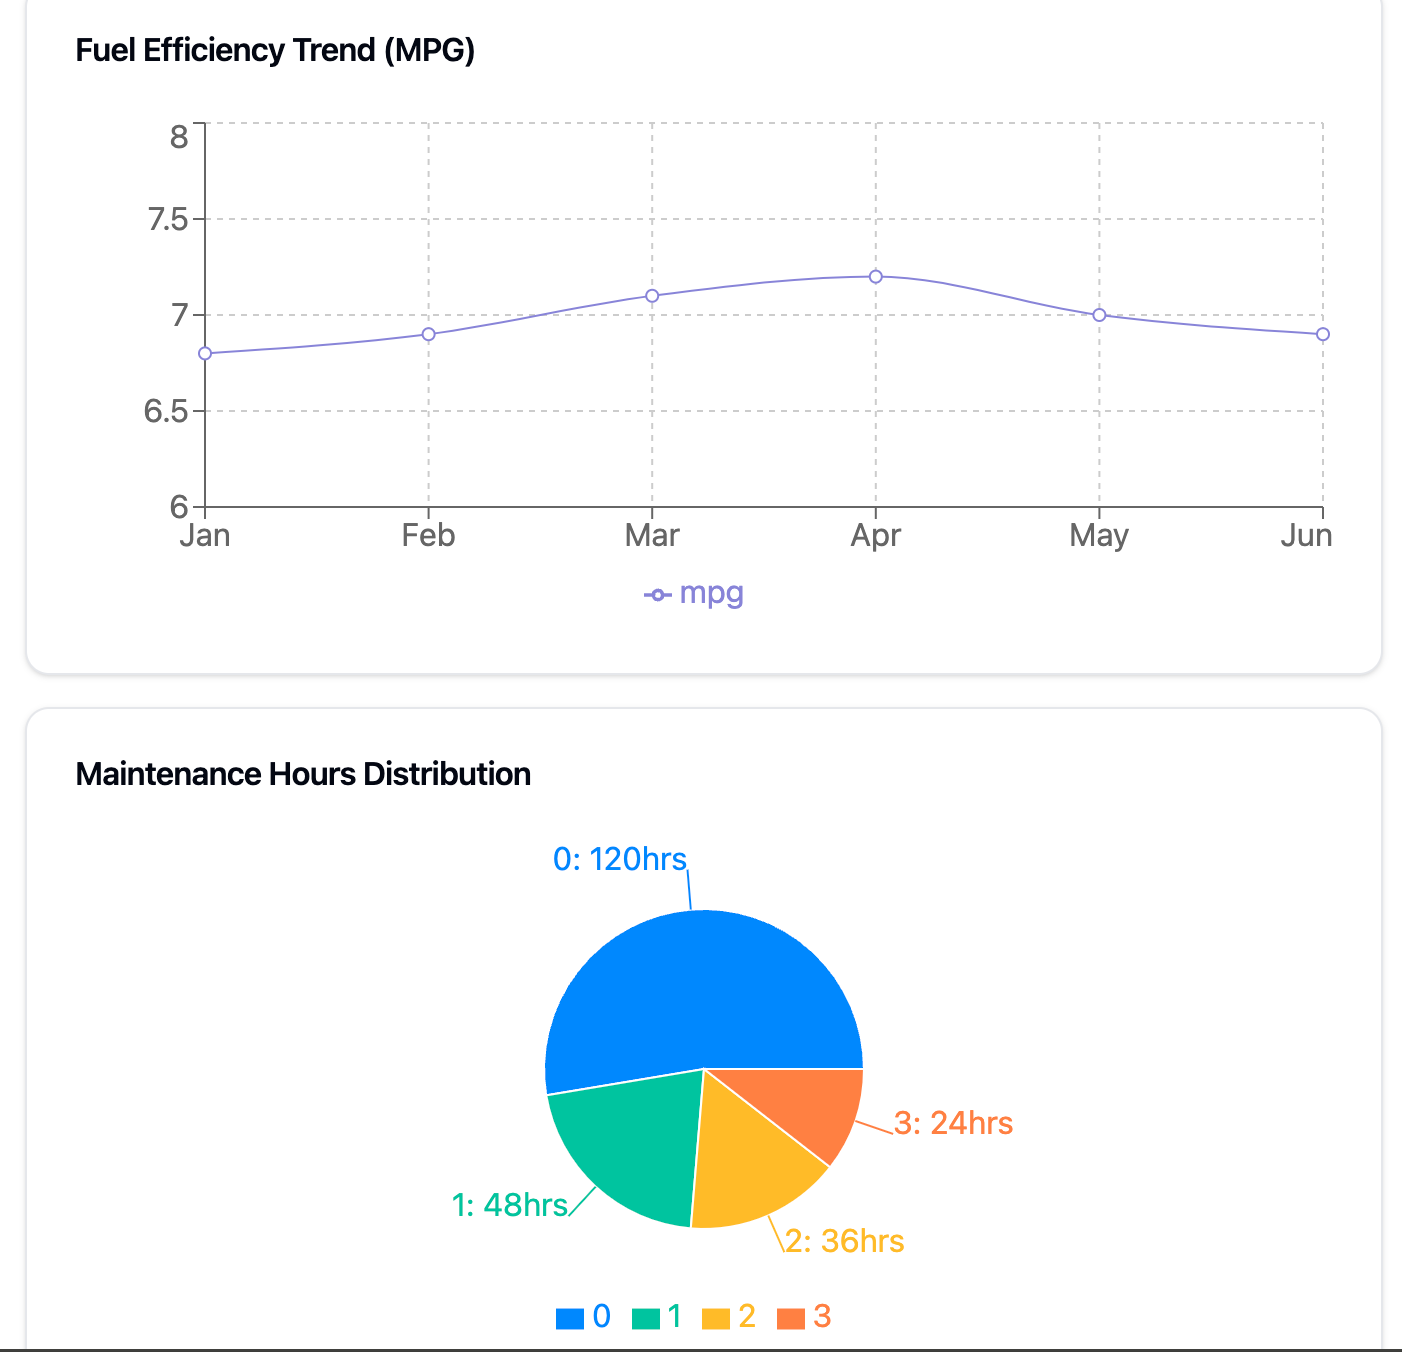
Visualization Example: Fleet Performance Dashboard
Using Power BI or Tableau, managers can create interactive dashboards that display:
- Vehicle location and status
- Maintenance schedules and alerts
- Fuel efficiency trends
- Driver safety scores
- Route completion times
2. Demand Forecasting and Capacity Planning
Accurate demand forecasting is crucial for optimal resource allocation. Advanced analytics tools can process historical data alongside external factors like weather patterns and seasonal trends to predict future demand with remarkable accuracy.
Key Analytics Applications:
- Seasonal demand pattern analysis
- Customer booking trend analysis
- Capacity utilization optimization
- Resource allocation planning
- Peak period prediction
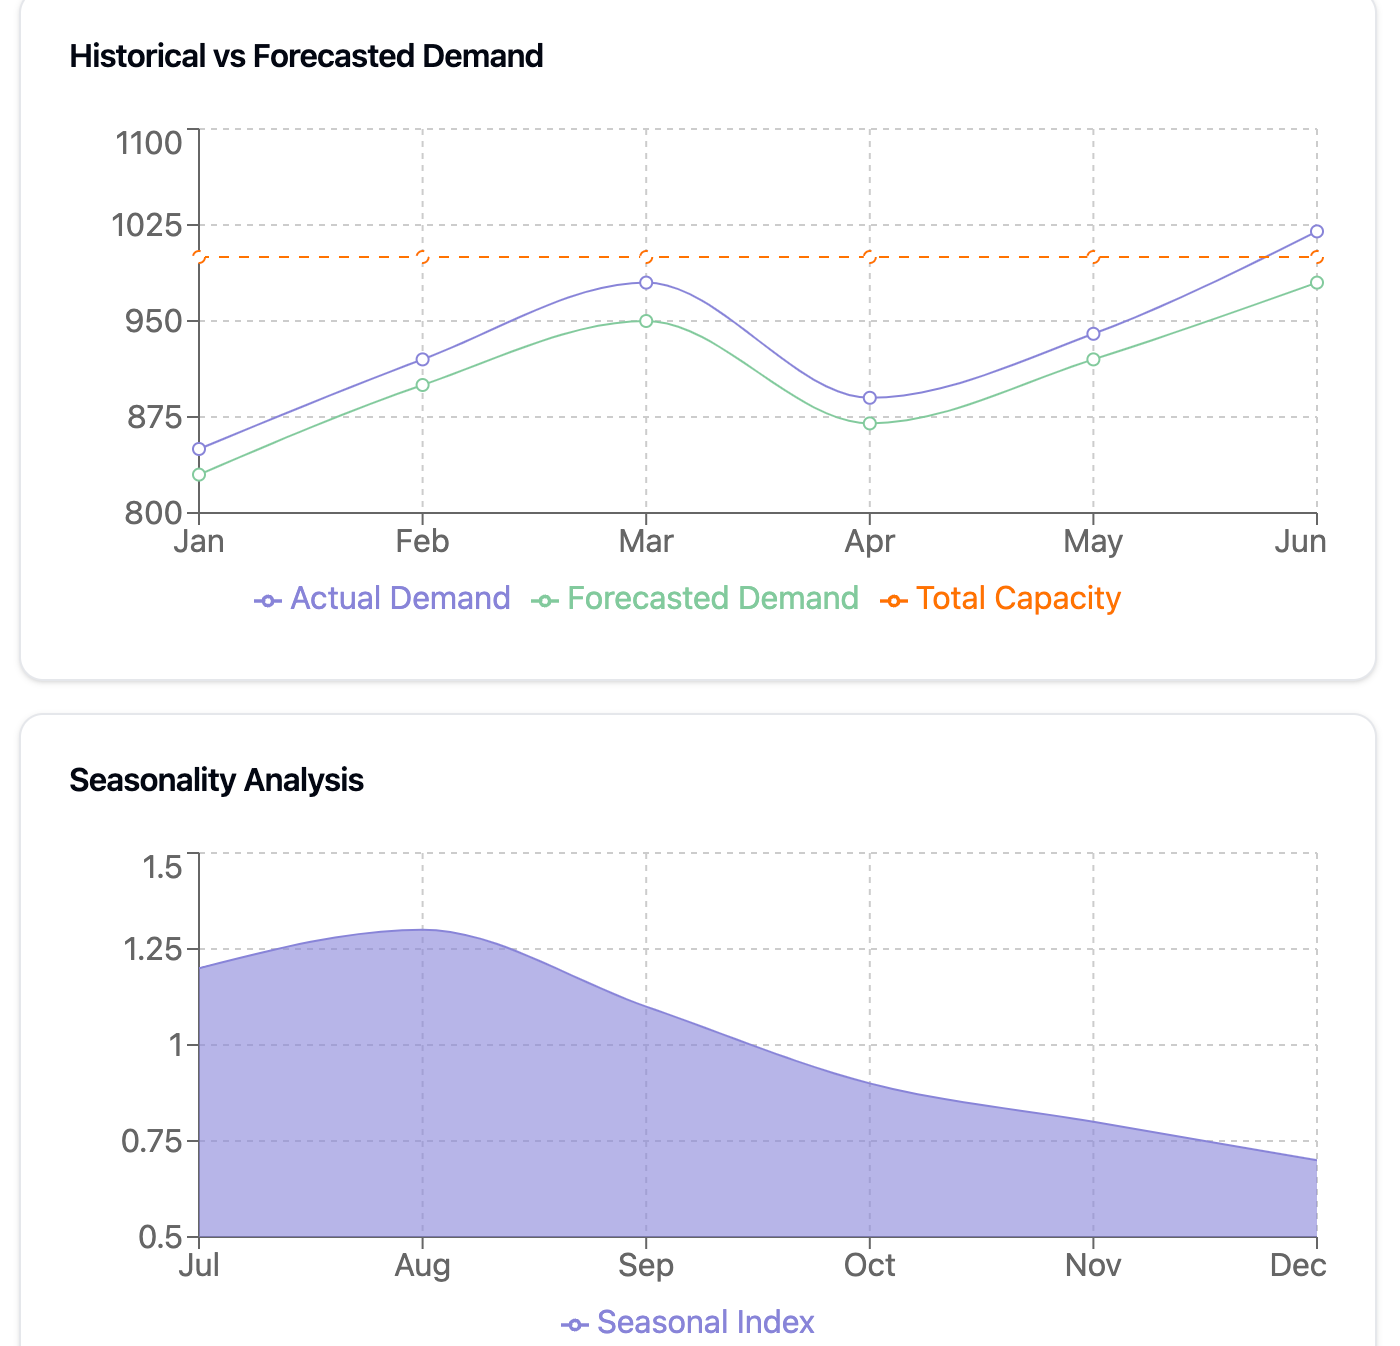
Visualization Example: Demand Forecasting Analysis
Python's Matplotlib and Seaborn libraries can create sophisticated visualizations showing:
- Historical demand patterns
- Seasonal trends
- Forecast accuracy
- Capacity utilization rates
- Peak period predictions
3. Customer Service and Satisfaction
Data analytics can transform customer service by providing deeper insights into customer behavior and preferences, enabling proactive problem-solving and personalized service delivery.
Key Analytics Applications:
- Customer satisfaction tracking
- Service quality monitoring
- Complaint pattern analysis
- Customer segmentation
- Delivery performance metrics
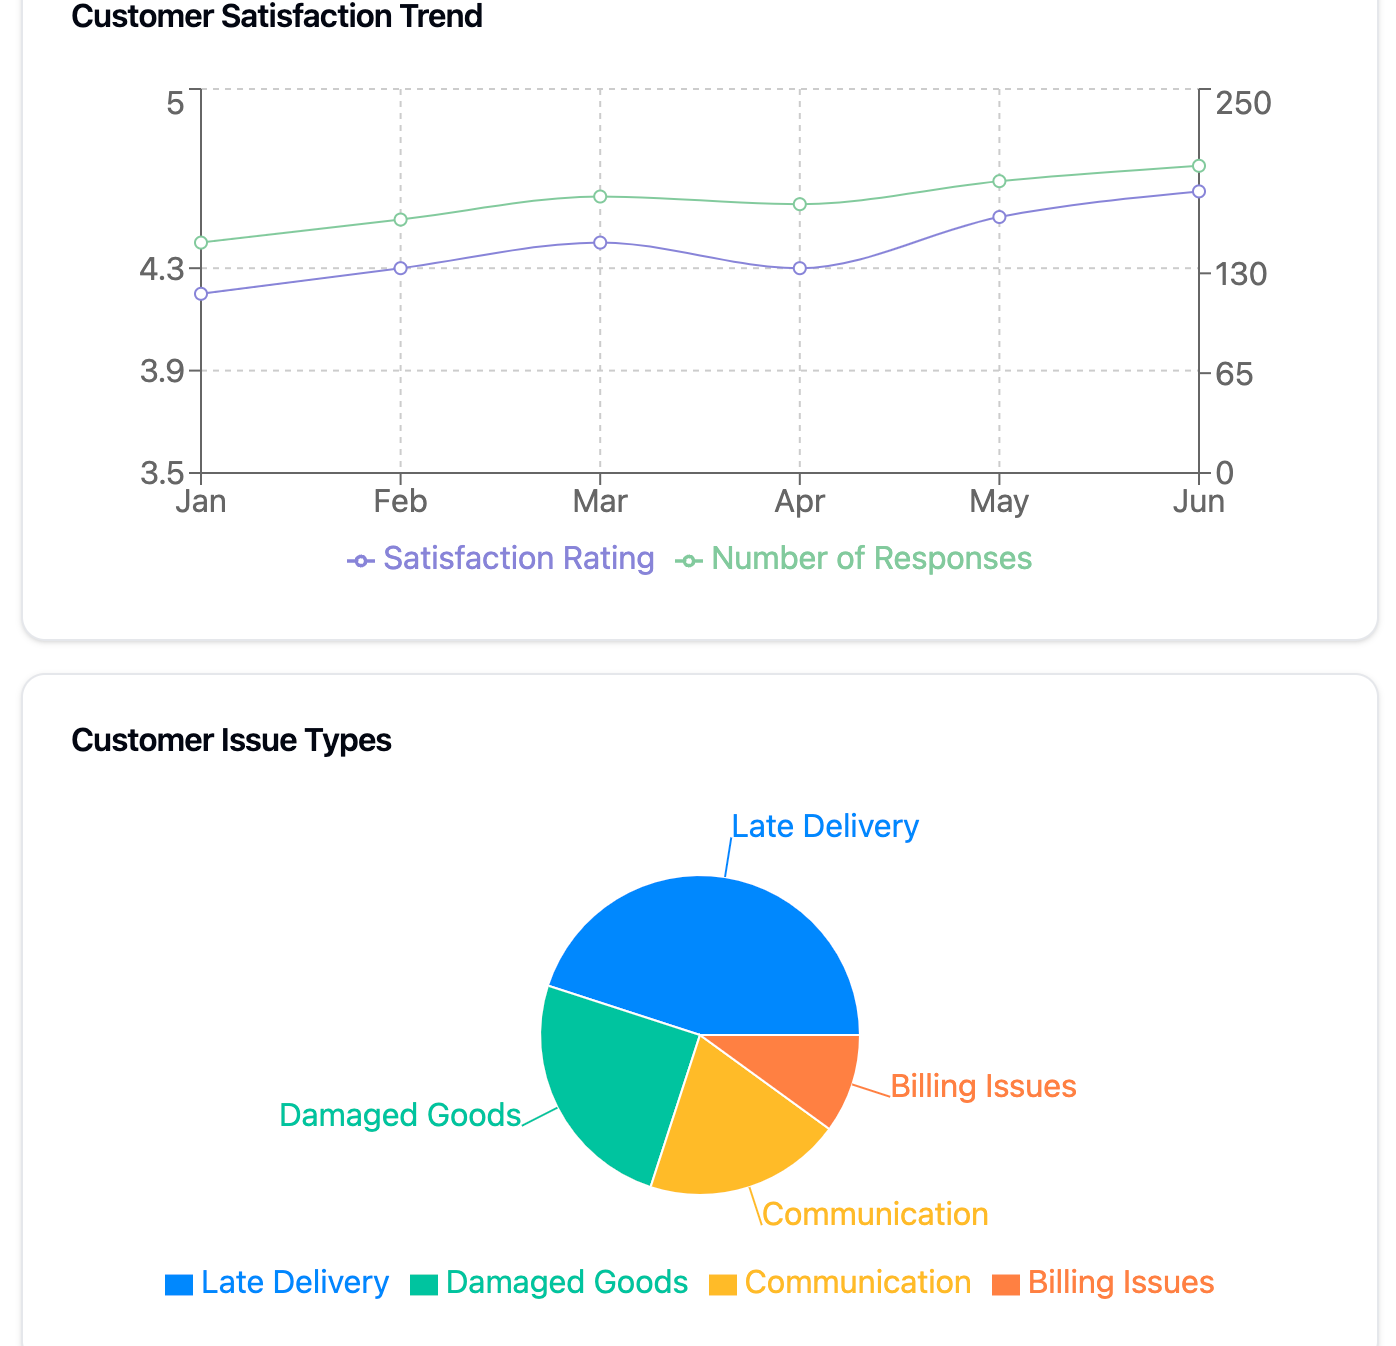
Visualization Example: Customer Satisfaction Dashboard
Streamlit can create interactive web applications showing:
- Customer satisfaction trends
- On-time delivery rates
- Response time metrics
- Service quality indicators
- Customer feedback analysis
4. Cost Management and Revenue Optimization
By analyzing operational costs alongside revenue streams, companies can identify opportunities for cost reduction and revenue growth.
Key Analytics Applications:
- Cost per mile analysis
- Revenue per route tracking
- Pricing optimization
- Resource utilization analysis
- Profit margin tracking
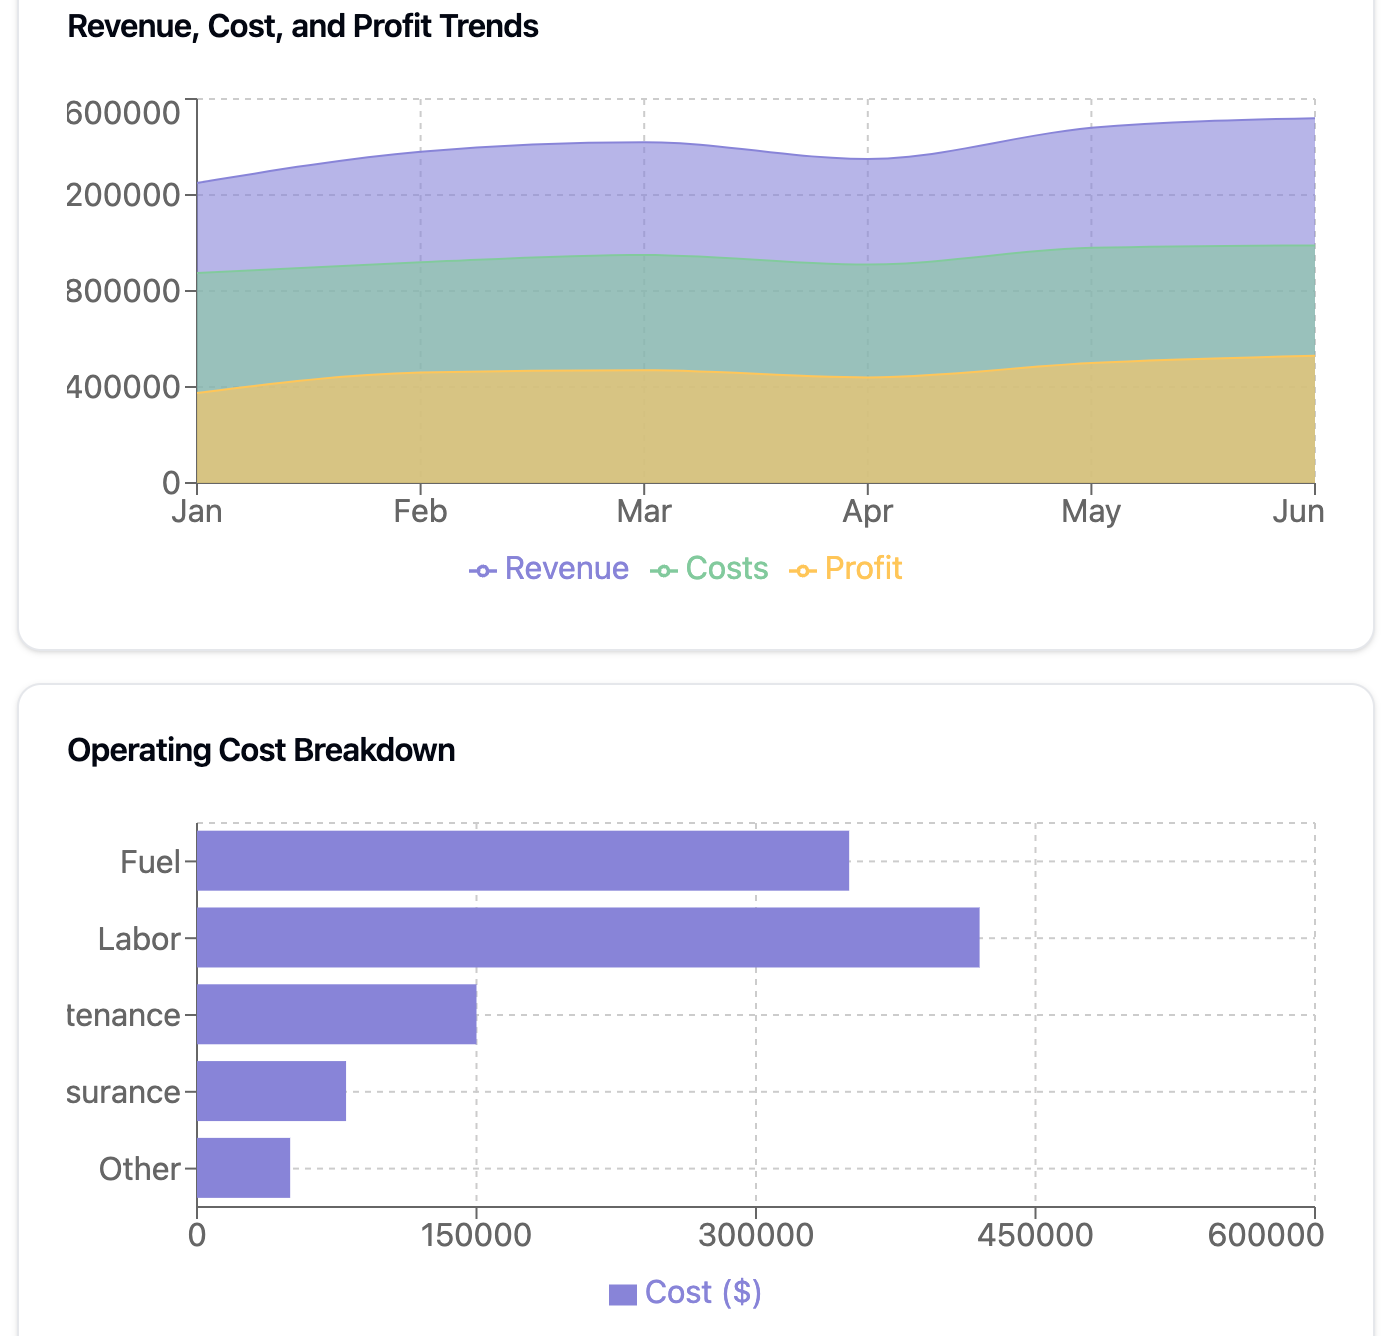
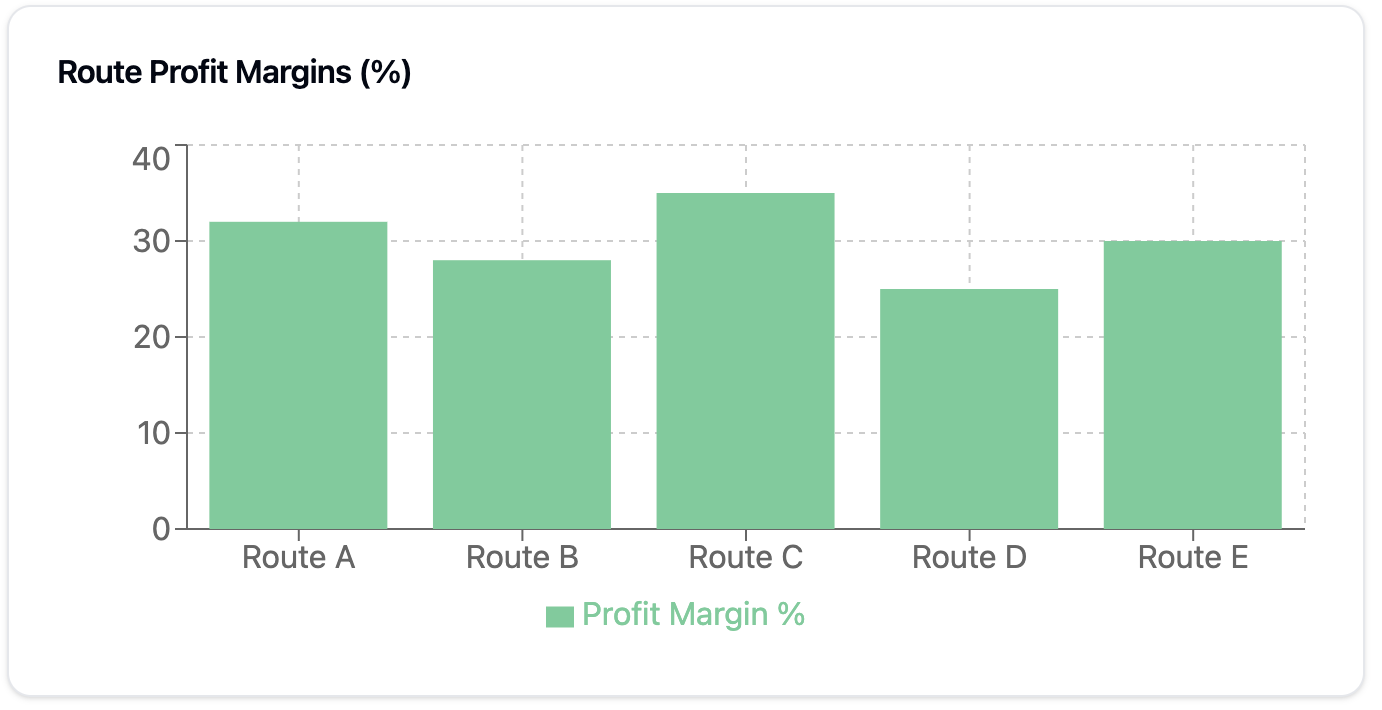
Visualization Example: Financial Performance Analytics
Tableau or Power BI can create comprehensive financial dashboards showing:
- Revenue trends by service type
- Cost breakdown analysis
- Profit margin by route
- Resource utilization efficiency
- ROI on various investments
5. Operational Efficiency and Process Improvement
Data analytics tools can help identify bottlenecks and inefficiencies in operations, leading to process improvements and better resource utilization.
Key Analytics Applications:
- Loading/unloading time analysis
- Warehouse efficiency metrics
- Cross-docking optimization
- Labor productivity tracking
- Equipment utilization monitoring
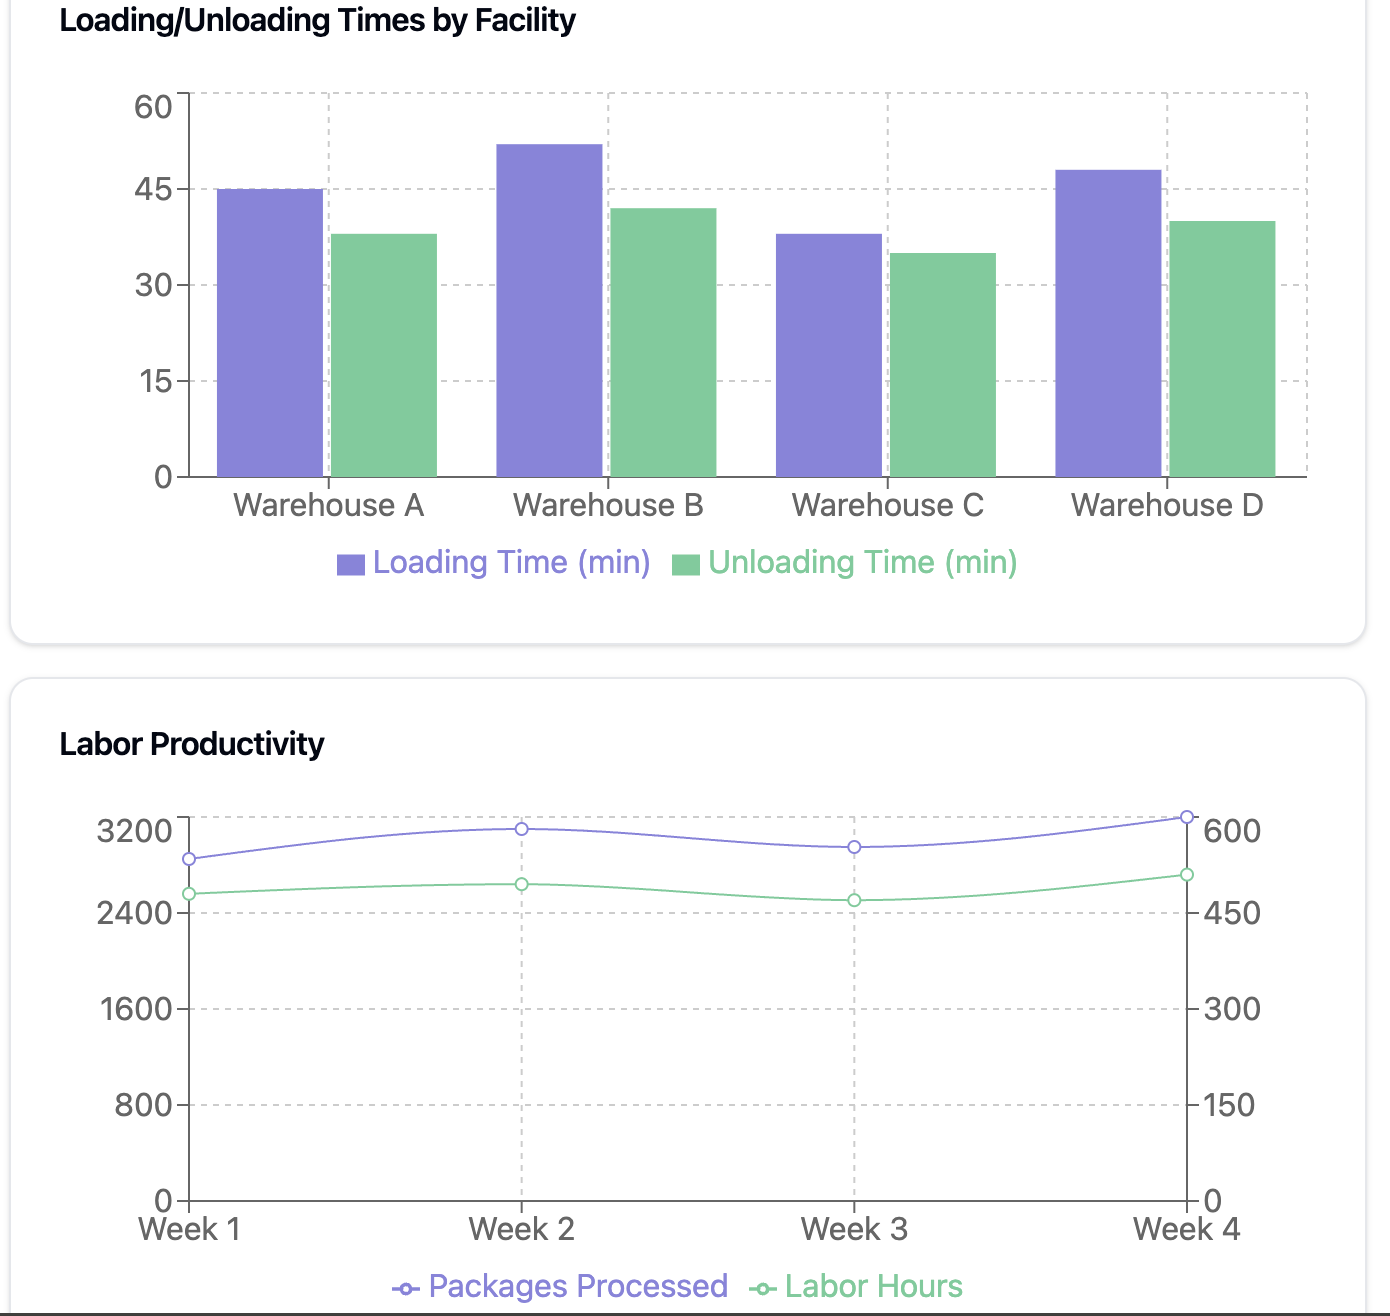
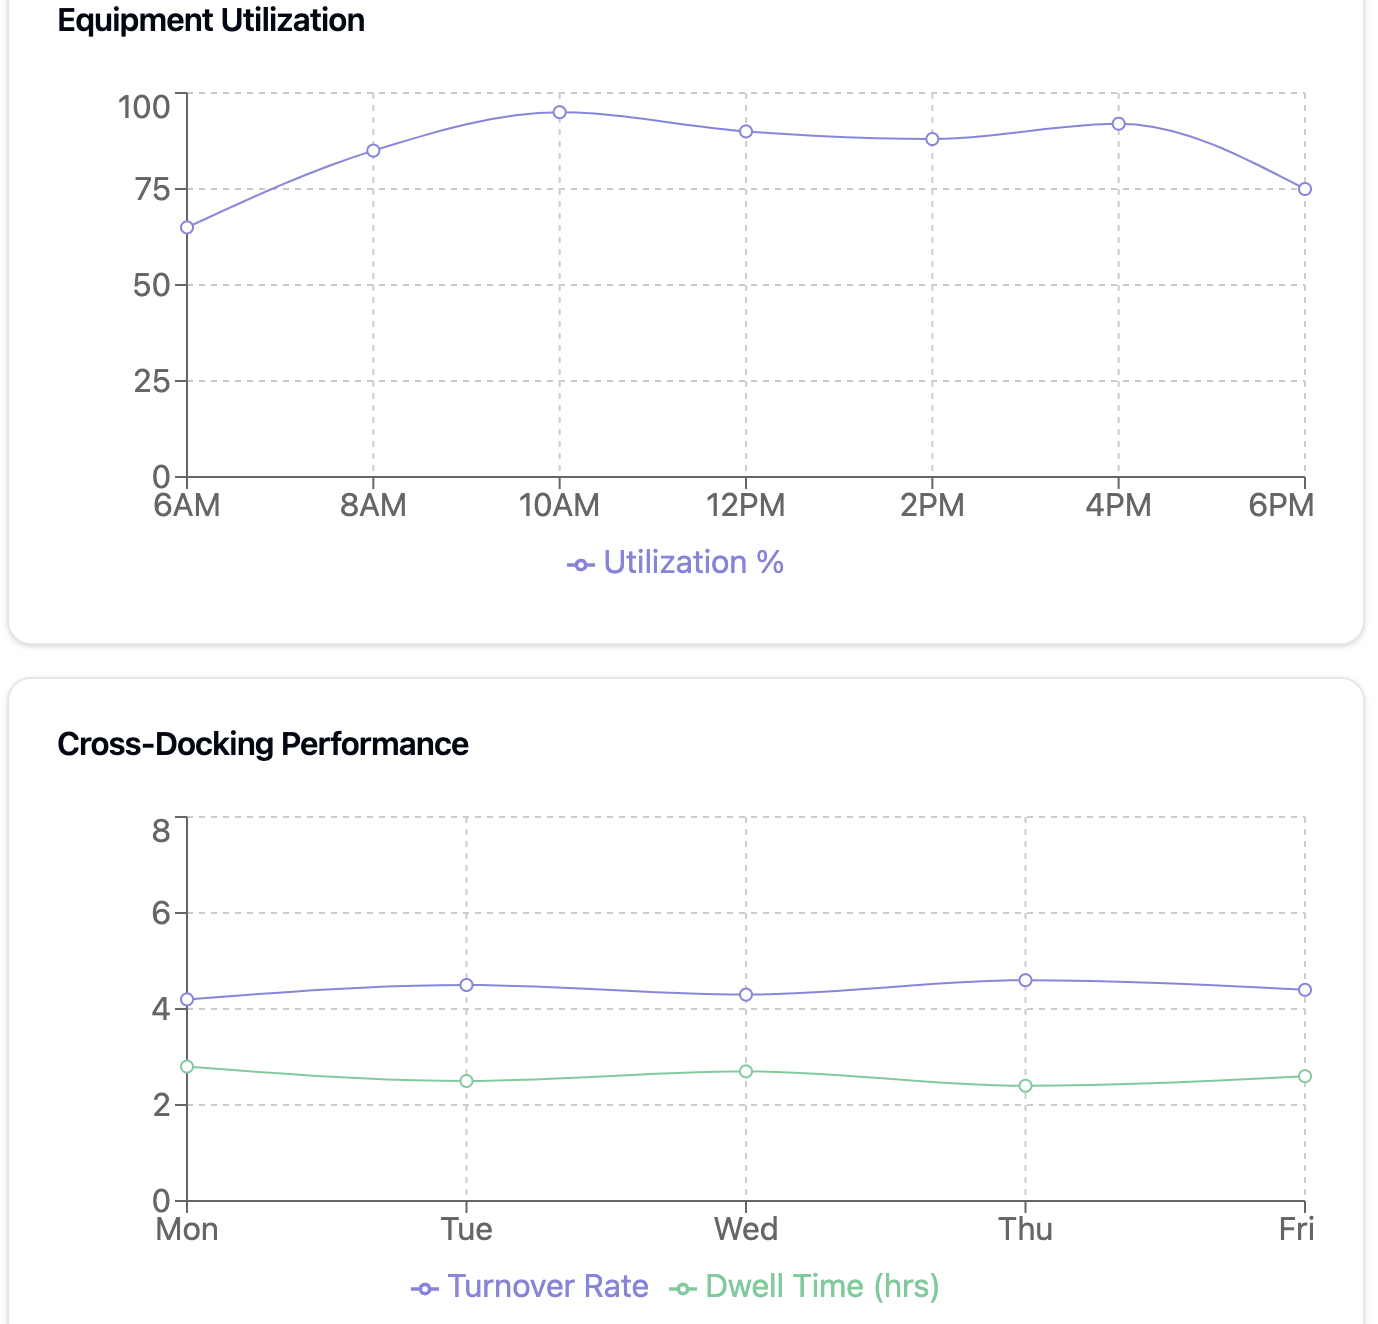
Visualization Example: Operational Efficiency Dashboard
Python-based tools can create detailed visualizations showing:
- Process bottleneck analysis
- Resource utilization patterns
- Labor productivity metrics
- Equipment efficiency trends
- Time-motion studies
Implementation Strategy and ROI
To maximize the benefits of data analytics tools, consider this implementation approach:
- Assessment Phase
- Audit current data collection processes
- Identify key performance indicators (KPIs)
- Evaluate technology requirements
- Set measurable goals
- Implementation Phase
- Deploy selected analytics tools
- Train staff on new systems
- Establish data governance protocols
- Create initial dashboards and reports
- Optimization Phase
- Monitor KPI improvements
- Refine analytics models
- Expand tool utilization
- Measure ROI
Expected Benefits
When properly implemented, these analytics tools can deliver:
- 10-15% reduction in fuel costs through route optimization
- 20-30% improvement in fleet utilization
- 15-25% reduction in maintenance costs
- 25-35% increase in customer satisfaction
- 10-20% improvement in overall operational efficiency
Conclusion
The implementation of data analytics tools represents a significant opportunity for Five Star Transportation to transform its operations. By leveraging these technologies effectively, the company can expect to see substantial improvements in productivity, efficiency, and profitability. The key is to approach implementation strategically, ensure proper training and adoption, and continuously monitor and adjust based on results.
Remember that the journey to becoming a data-driven organization is ongoing. Start with the most impactful areas, build on successes, and gradually expand the use of analytics across the organization. The investment in these tools will pay dividends in improved operations, better customer service, and increased profitability.
These are some of the items that I will be presenting to senior management to start to incorporate more and more into the Five Star way of doing things.
Website: Five Star Transportation
Contact: quality@fivestartrans.com